
Please use this button on your site for DigiLit Sunday posts
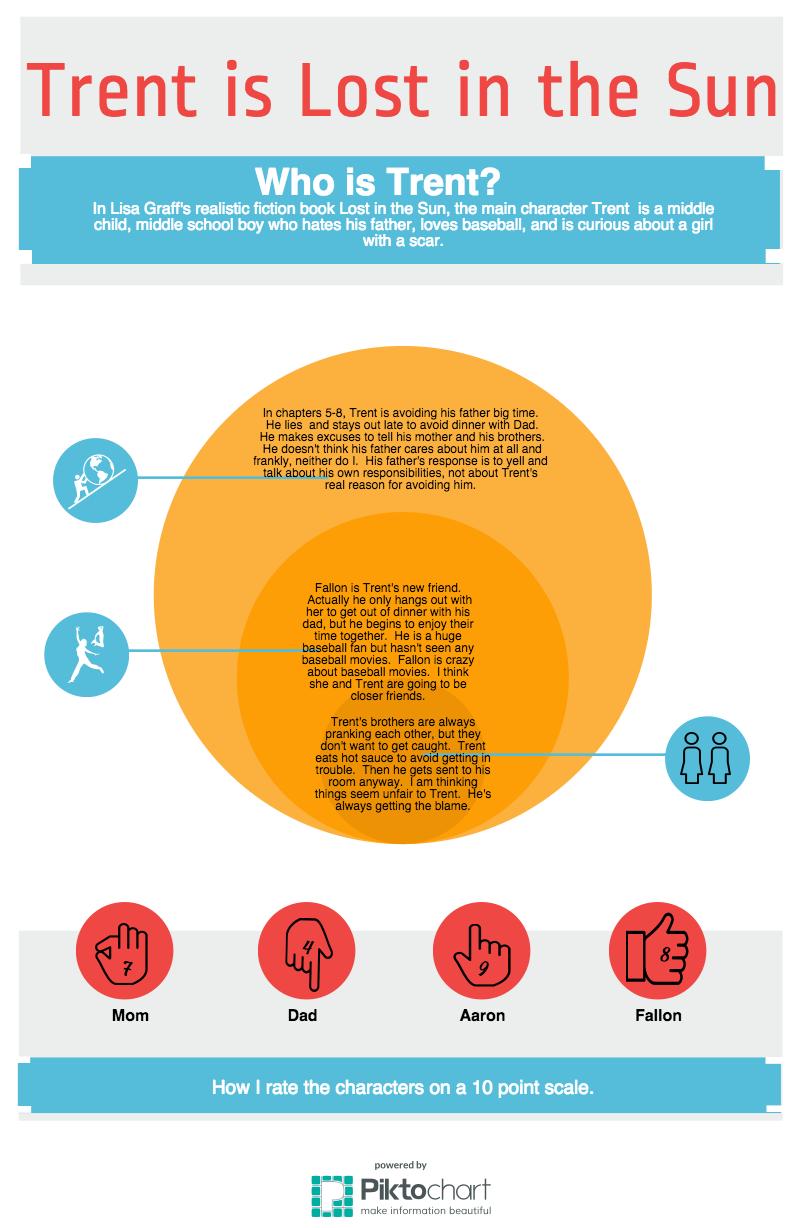
Once again I am playing around with apps to use with my students. For my reader response this week with my virtual book club, I tried using Piktochart. I have mixed feelings about the results.
Piktochart is designed for business presentations that include data. Data is not my thing. Reading and writing is. So how could I re-use this program to fit in with digital literacy?
I chose a report template from the few free ones provided. Adding in a text box was cumbersome. We have gotten so accustomed to apps reading our minds. The text box never appeared where I wanted it to go, so I struggled to move it and arrange it. I don’t think students would have as much difficulty. They tend to be more savy with a mouse.
The part I did like about this process was the motivation to graphically design the ideas. Design is becoming a big part of digital media. If we tap into design with our students, I believe we add another element to their learning and processing. Making a product to represent their response to reading is a way to authentically create digital media. I may be wrong, but I think it would take some of the chore out of reader response. I still believe strongly in choice, so Piktochart will go on my list of choices for responding to reading.
Link up your digital literacy posts:


